Conheça mais sobre nossos Serviços

Desenvolvimento de Sistemas
Transforme a gestão do seu negócio com soluções tecnológicas sob medida.
Desenvolvemos sistemas inteligentes, modernos e totalmente adaptados às necessidades da sua empresa, integrando eficiência, automação e praticidade em um único ambiente.

Análise Dados com Microsoft Power BI
Oferecemos soluções completas de análise e visualização de dados com Power BI, desenvolvidas para que sua empresa tenha insights claros, rápidos e assertivos.
Com dashboards personalizados, você acompanha indicadores de desempenho, resultados financeiros, operacionais e de mercado em tempo real tudo em uma única plataforma interativa e intuitiva.

Treinamento Especializados em Power BI e Microsoft Excel
Oferecemos treinamentos corporativos e consultorias personalizadas em Microsoft Excel e Power BI, voltados para empresas que desejam aprimorar suas rotinas de análise, relatórios e gestão de indicadores.
Nossos programas são elaborados de forma prática e orientada à realidade do seu negócio, garantindo que cada participante aprenda a aplicar as ferramentas no dia a dia, aumentando a produtividade, precisão e eficiência nas tomadas de decisão.
Fluxos de Processos
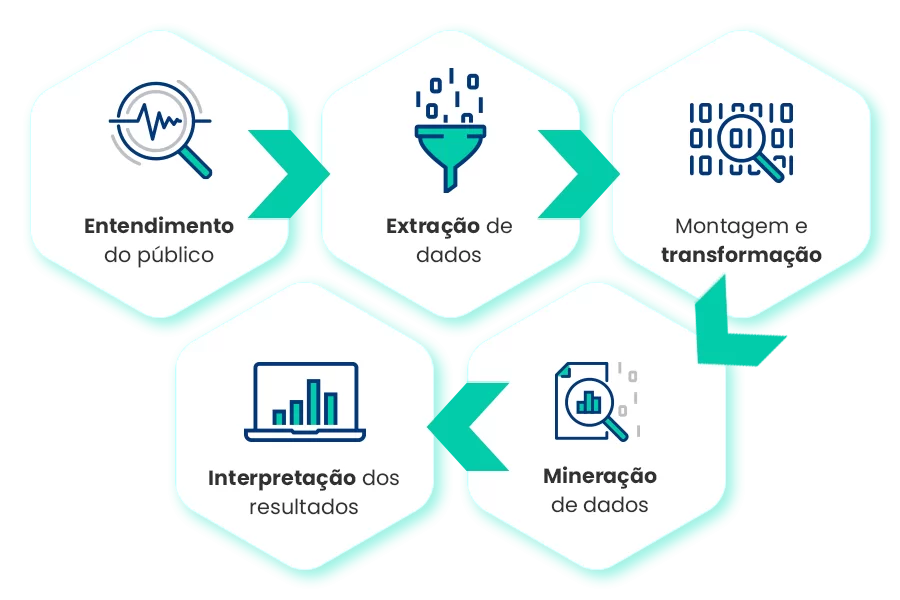
Análise Dados
A Date Analytics transforma dados em decisões estratégicas por meio de um processo completo que envolve o entendimento do público, extração e transformação de dados, mineração de informações e interpretação de resultados.
Com uma abordagem analítica e inteligente, ajudamos sua empresa a descobrir oportunidades, otimizar processos e tomar decisões mais assertivas.
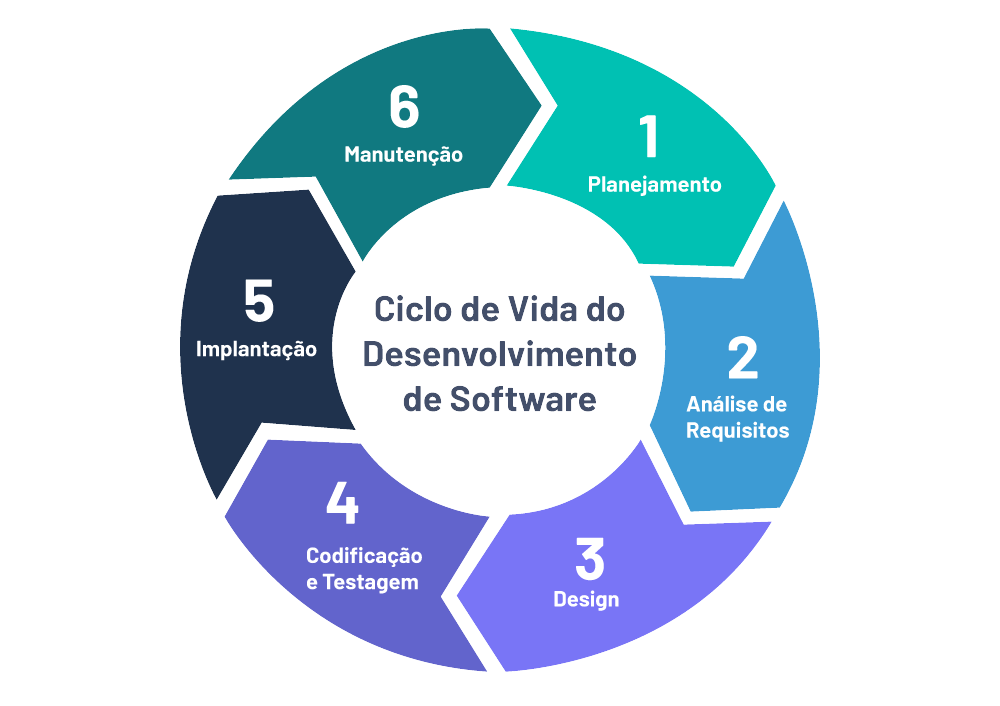
Desenvolvendo Sistemas
Na Date Analytics, oferecemos um processo completo de desenvolvimento de sistemas, desde a análise de requisitos até a implementação e manutenção. Nosso objetivo é criar soluções sob medida que aumentem a produtividade, otimizem processos e garantam resultados mensuráveis para sua empresa.
Combinamos tecnologia de ponta, metodologias ágeis e expertise em desenvolvimento, garantindo sistemas intuitivos, escaláveis e seguros. Cada projeto é pensado para atender às necessidades do seu negócio, integrando inovação e eficiência em cada etapa.
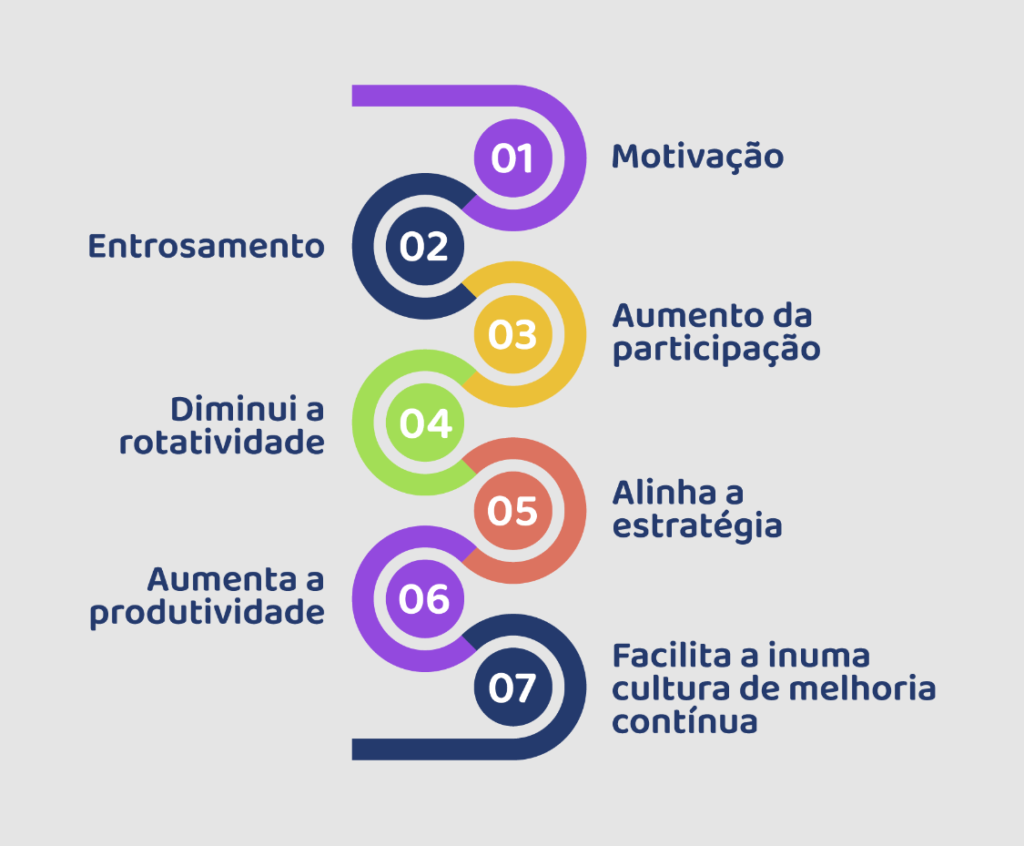
Treinamento & Desenvolvimento
Nossa empresa ferecemos treinamentos e consultoria especializada em ferramentas como Microsoft Excel e Power BI, transformando dados em decisões estratégicas para sua empresa. Nosso método combina teoria, prática e acompanhamento personalizado, garantindo que sua equipe esteja preparada para extrair o máximo das soluções digitais disponíveis.
Com foco em eficiência, produtividade e tomada de decisão baseada em dados, ajudamos sua empresa a alcançar resultados consistentes e mensuráveis. Cada sessão é planejada para atender às necessidades específicas do seu negócio, garantindo aprendizado aplicável e imediata geração de valor.
A Date Analytics é uma empresa especializada em Análise de Dados, Business Intelligence e Desenvolvimento de Sistemas Personalizados, oferecendo soluções sob medida para empresas que desejam tomar decisões com base em informações reais e precisas.
Combinando expertise técnica, visão estratégica e foco em resultados, a Date Analytics atua na estruturação de dados, construção de dashboards inteligentes e automação de processos, garantindo maior eficiência operacional e vantagem competitiva para o seu negócio.